

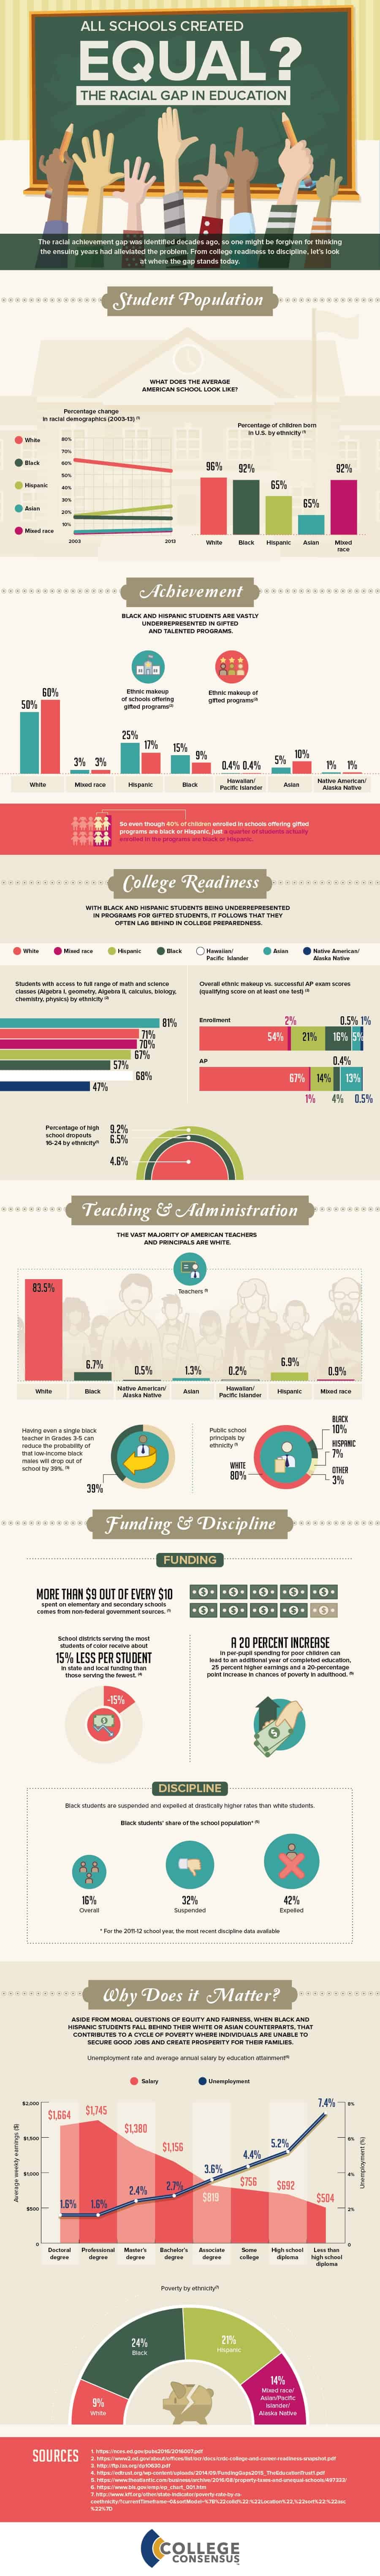
Student Population
What does the average American school look like?
Percentage change in racial demographics (2003-13) (1)
Ethnicity: 2003: 2013
White: 62%: 53%
Black: 15%: 14%
Hispanic: 16%: 24%
Asian: 3%: 5%
Mixed race: 2%: 4%
Percentage of children born in U.S. by ethnicity (1)
White: 96%
Black: 92%
Hispanic: 65%
Asian: 33%
Mixed race: 92%
Achievement
Black and Hispanic students are vastly underrepresented in gifted and talented programs.
Ethnic makeup of schools offering gifted programs (2)
White: 50%
Mixed race: 3%
Hispanic: 25%
Black: 15%
Hawaiian/Pacific Islander: 0.4%
Asian: 5%
Native American/Alaska Native: 1%
Ethnic makeup of gifted programs (2)
White: 60%
Mixed race: 3%
Hispanic: 17%
Black: 9%
Hawaiian/Pacific Islander: 0.4%
Asian: 10%
Native American/Alaska Native: 1%
So even though 40% of children enrolled in schools offering gifted programs are black or Hispanic, just a quarter of students actually enrolled in the programs are black or Hispanic.
College Readiness
With black and Hispanic students being underrepresented in programs for gifted students, it follows that they often lag behind in college preparedness.
Students with access to full range of math and science classes (Algebra I, geometry, Algebra II, calculus, biology, chemistry, physics) by ethnicity (2)
Asian: 81%
White: 71%
Mixed race: 70%
Hispanic: 67%
Black: 57%
Hawaiian/Pacific Islander: 68%
Native American/Alaska Native: 47%
Overall ethnic makeup vs. successful AP exam scores (qualifying score on at least one test) (2)
Ethnicity: Enrollment: AP success
White: 54%: 67%
Mixed race: 2%: 1%
Hispanic: 21%: 14%
Black: 16%: 4%
Hawaiian/Pacific Islander: 0.5%: 0.4%
Asian: 5%: 13%
Native American/Alaska Native: 1%: 0.5%
Percentage of high school dropouts 16-24 by ethnicity (1)
Hispanic: 9.2%
Black: 6.5%
White: 4.6%
Teaching & Administration
The vast majority of American teachers and principals are white.
Teachers (1)
White: 83.5%
Black: 6.7%
Native American/Alaska Native: 0.5%
Asian: 1.3%
Hawaiian/Pacific Islander: 0.2%
Hispanic: 6.9%
Mixed race: 0.9%
Having even a single black teacher in Grades 3-5 can reduce the probability of that low-income black males will drop out of school by 39%. (3)
Public school principals by ethnicity (1)
White: 80%
Black: 10%
Hispanic: 7%
Other: 3%
Funding & Discipline
Funding
More than $9 out of every $10 spent on elementary and secondary schools comes from non-federal government sources. (1)
School districts serving the most students of color receive about 15% less per student in state and local
funding than those serving the fewest. (4)
A 20 percent increase in per-pupil spending for poor children can lead to an additional year of completed education, 25 percent higher earnings and a 20-percentage point increase in chances of poverty in adulthood. (5)
Discipline
Black students are suspended and expelled at drastically higher rates than white students.
Black students’ share of the school population*(5)
Overall: 16%
Suspended: 32%
Expelled: 42%
* For the 2011-12 school year, the most recent discipline data available
Why Does it Matter?
Aside from moral questions of equity and fairness, when black and Hispanic students fall behind their white or Asian counterparts, that contributes to a cycle of poverty where individuals are unable to secure good jobs and create prosperity for their families.
Unemployment rate and average annual salary by education attainment (6)
Education: Unemployment: Average weekly earnings
Doctoral degree: 1.6%: $1,664
Professional degree: 1.6%: $1,745
Master’s degree: 2.4%: $1,380
Bachelor’s degree: 2.7%: $1,156
Associate degree: 3.6%: $819
Some college: 4.4%: $756
High school diploma: 5.2%: $692
Less than high school diploma: 7.4%: $504
Poverty by ethnicity (7)
White: 9%
Black: 24%
Hispanic: 21%
Mixed race/Asian/Pacific Islander/Alaska Native: 14%:
SOURCES:
1. https://nces.ed.gov/pubs2016/2016007.pdf
2. https://www2.ed.gov/about/offices/list/ocr/docs/crdc-college-and-career-readiness-snapshot.pdf
3. https://ftp.iza.org/dp10630.pdf
4. https://edtrust.org/wp-content/uploads/2014/09/FundingGaps2015_TheEducationTrust1.pdf
5. https://www.theatlantic.com/business/archive/2016/08/property-taxes-and-unequal-schools/497333/